

CLIENT EDUCATION SERIES | ARTICLE 1 OF 4
From the October 2007 peak to the March 2009 low
On October 9, 2007, the S&P 500 closed at a record. Seventeen months later, on March 9, 2009, it had lost more than half its price. For investors living through it, the decline did not feel like a tidy historical episode. It felt like a series of increasingly serious breaks in the financial system.
How the crisis unfolded
2007: Housing weakness spreads
Falling home prices and rising mortgage delinquencies exposed losses in securities built on risky loans. Credit became harder to obtain, and confidence in financial institutions began to erode.
March 2008: Bear Stearns is rescued
The near-failure of a major investment bank showed that mortgage losses were no longer contained.
September 2008: The crisis accelerates
Fannie Mae and Freddie Mac entered conservatorship; Lehman Brothers failed; AIG required government support; money and credit markets came under severe strain.
Late 2008: Recession and forced selling reinforce each other
Businesses cut spending, unemployment rose, investors sought liquidity, and falling prices created still more fear.
March 2009: Markets bottom before the news improves
The S&P 500 reached its bear-market low on March 9. The economy and headlines still looked grim, which is precisely why buying or even holding felt so difficult.
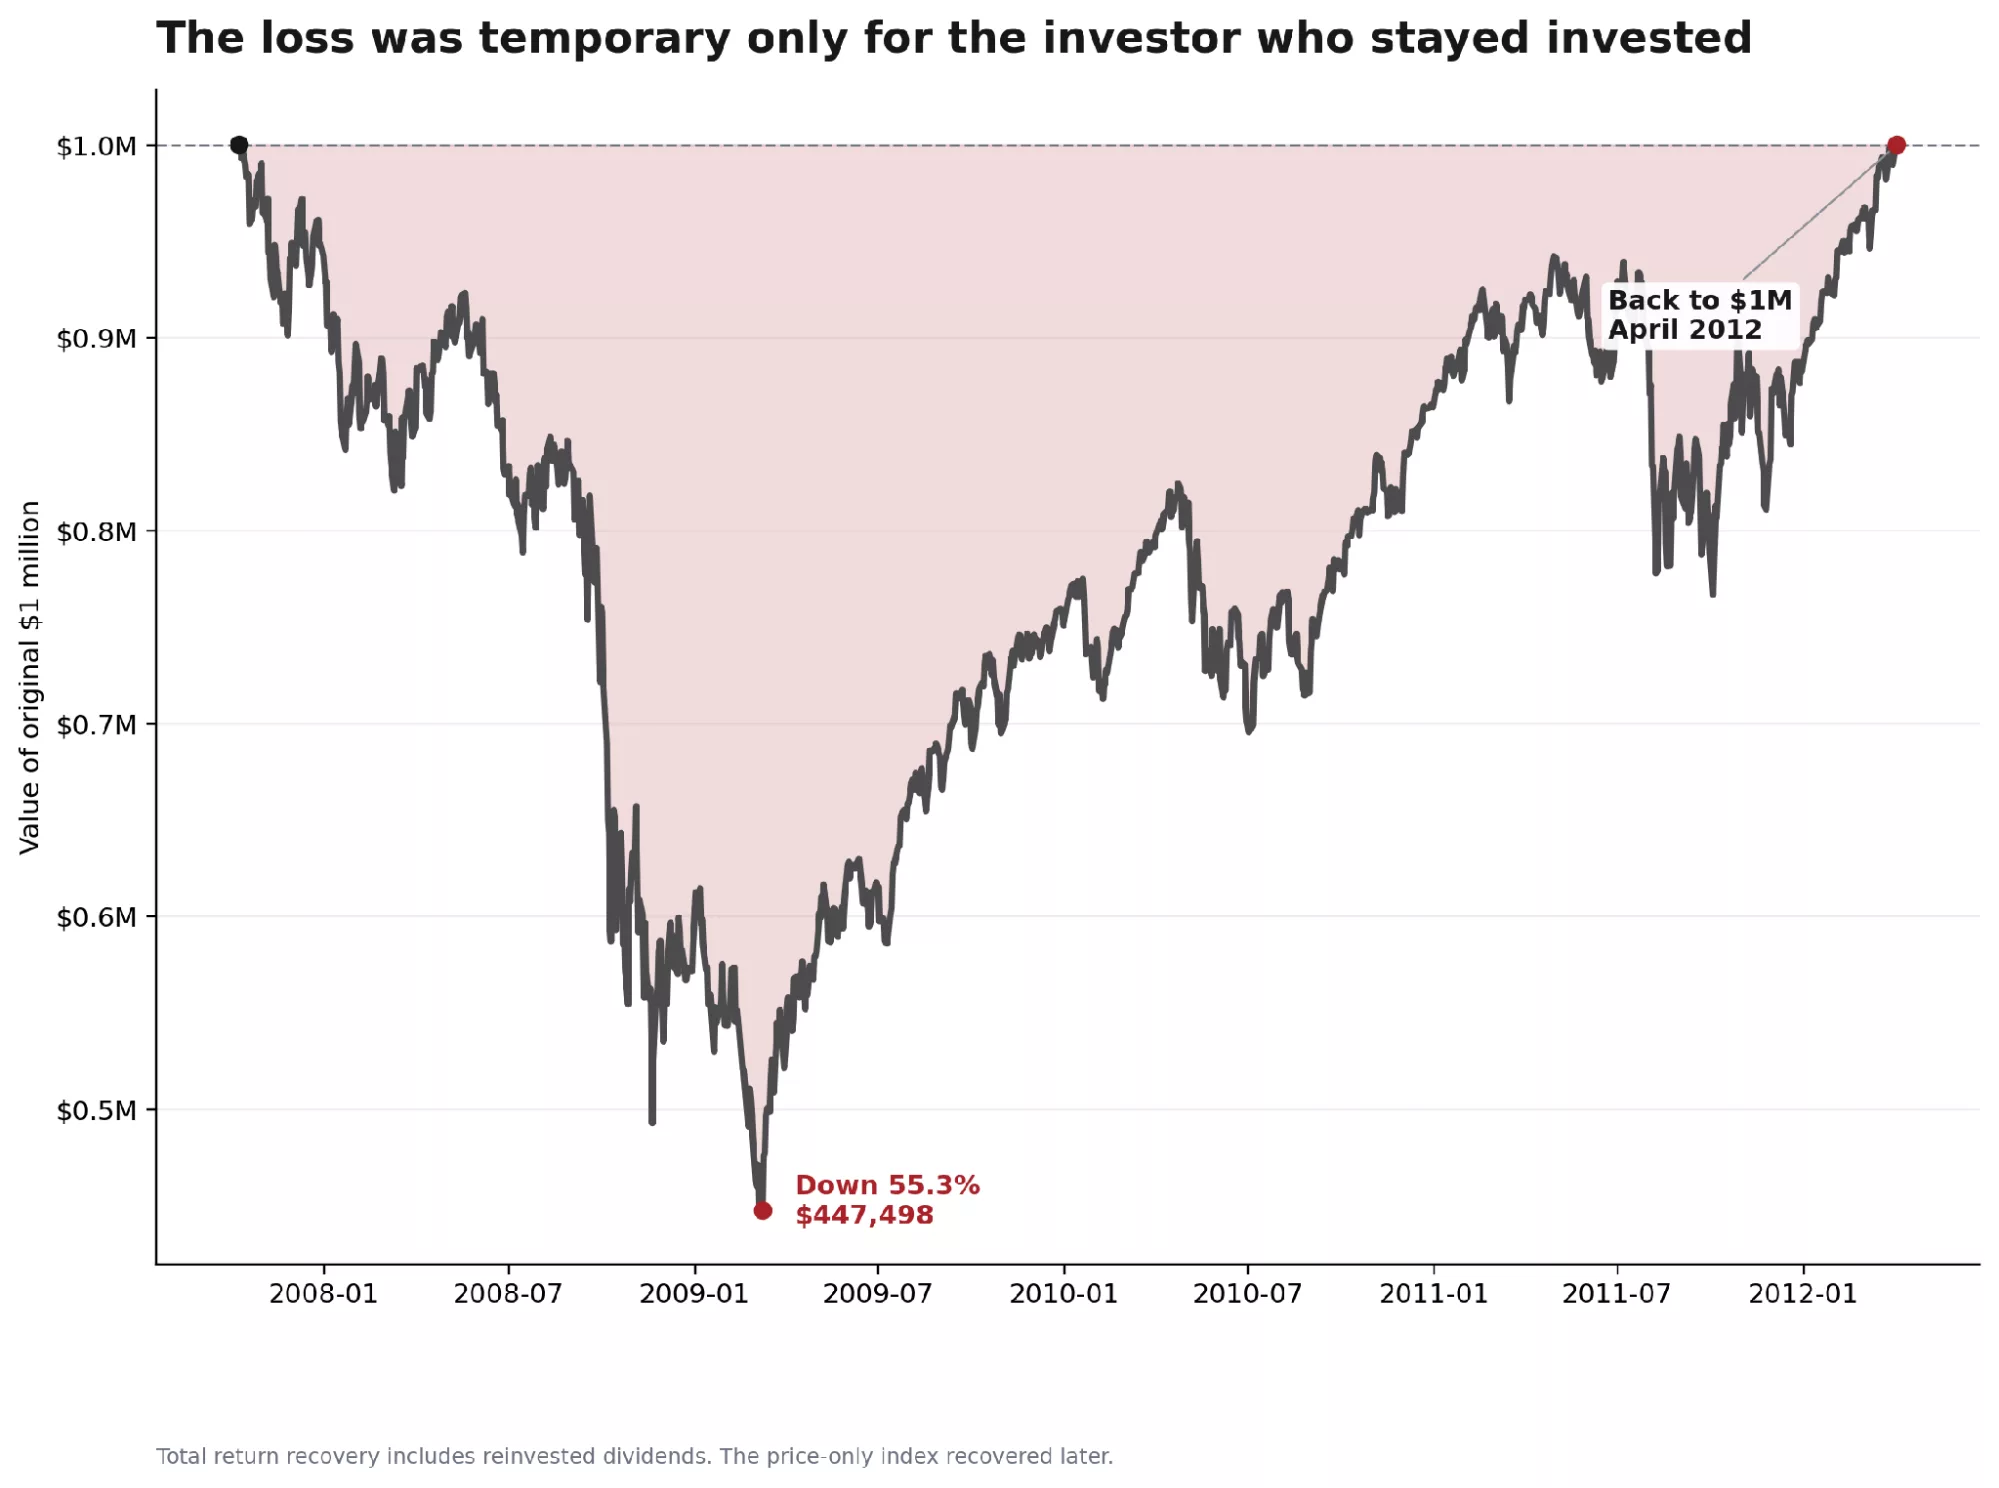
What $1 million felt like. A hypothetical $1,000,000 investment in the S&P 500 Total Return Index at the October 2007 peak had fallen to approximately $447,498 by March 9, 2009, a decline of 55.3%.
A question worth considering
If a decline of this size occurred again, what part of your plan would keep you from having to sell?
About the illustration
The hypothetical illustrations use the S&P 500 Total Return Index, assume reinvested dividends, and exclude fees, expenses, taxes, withdrawals, advisory charges, and transaction costs. After selling, the panic seller is modeled using the daily 3-month Treasury constant-maturity yield as an illustrative cash-equivalent proxy. The March 9, 2009 market low is used with hindsight and was not identifiable in advance.
This material is for educational purposes only and is not personalized investment advice or a recommendation. Indexes are unmanaged and cannot be invested in directly. Investing involves risk, including possible loss of principal. Past performance does not guarantee future results.
Securities and investment advisory services offered through &Partners, LLC, a broker-dealer and investment adviser registered with the U.S. Securities and Exchange Commission and member FINRA, SIPC.
This content was created with the assistance of artificial intelligence (AI).

