

CLIENT EDUCATION SERIES | ARTICLE 3 OF 4
Markets anticipate; headlines confirm
The hardest feature of a market bottom is that it rarely arrives with reassuring news. Prices turn when expectations become less bad, not when the problems have disappeared. In March 2009, unemployment was still rising and the recession had not officially ended. Yet the market had already begun its recovery.
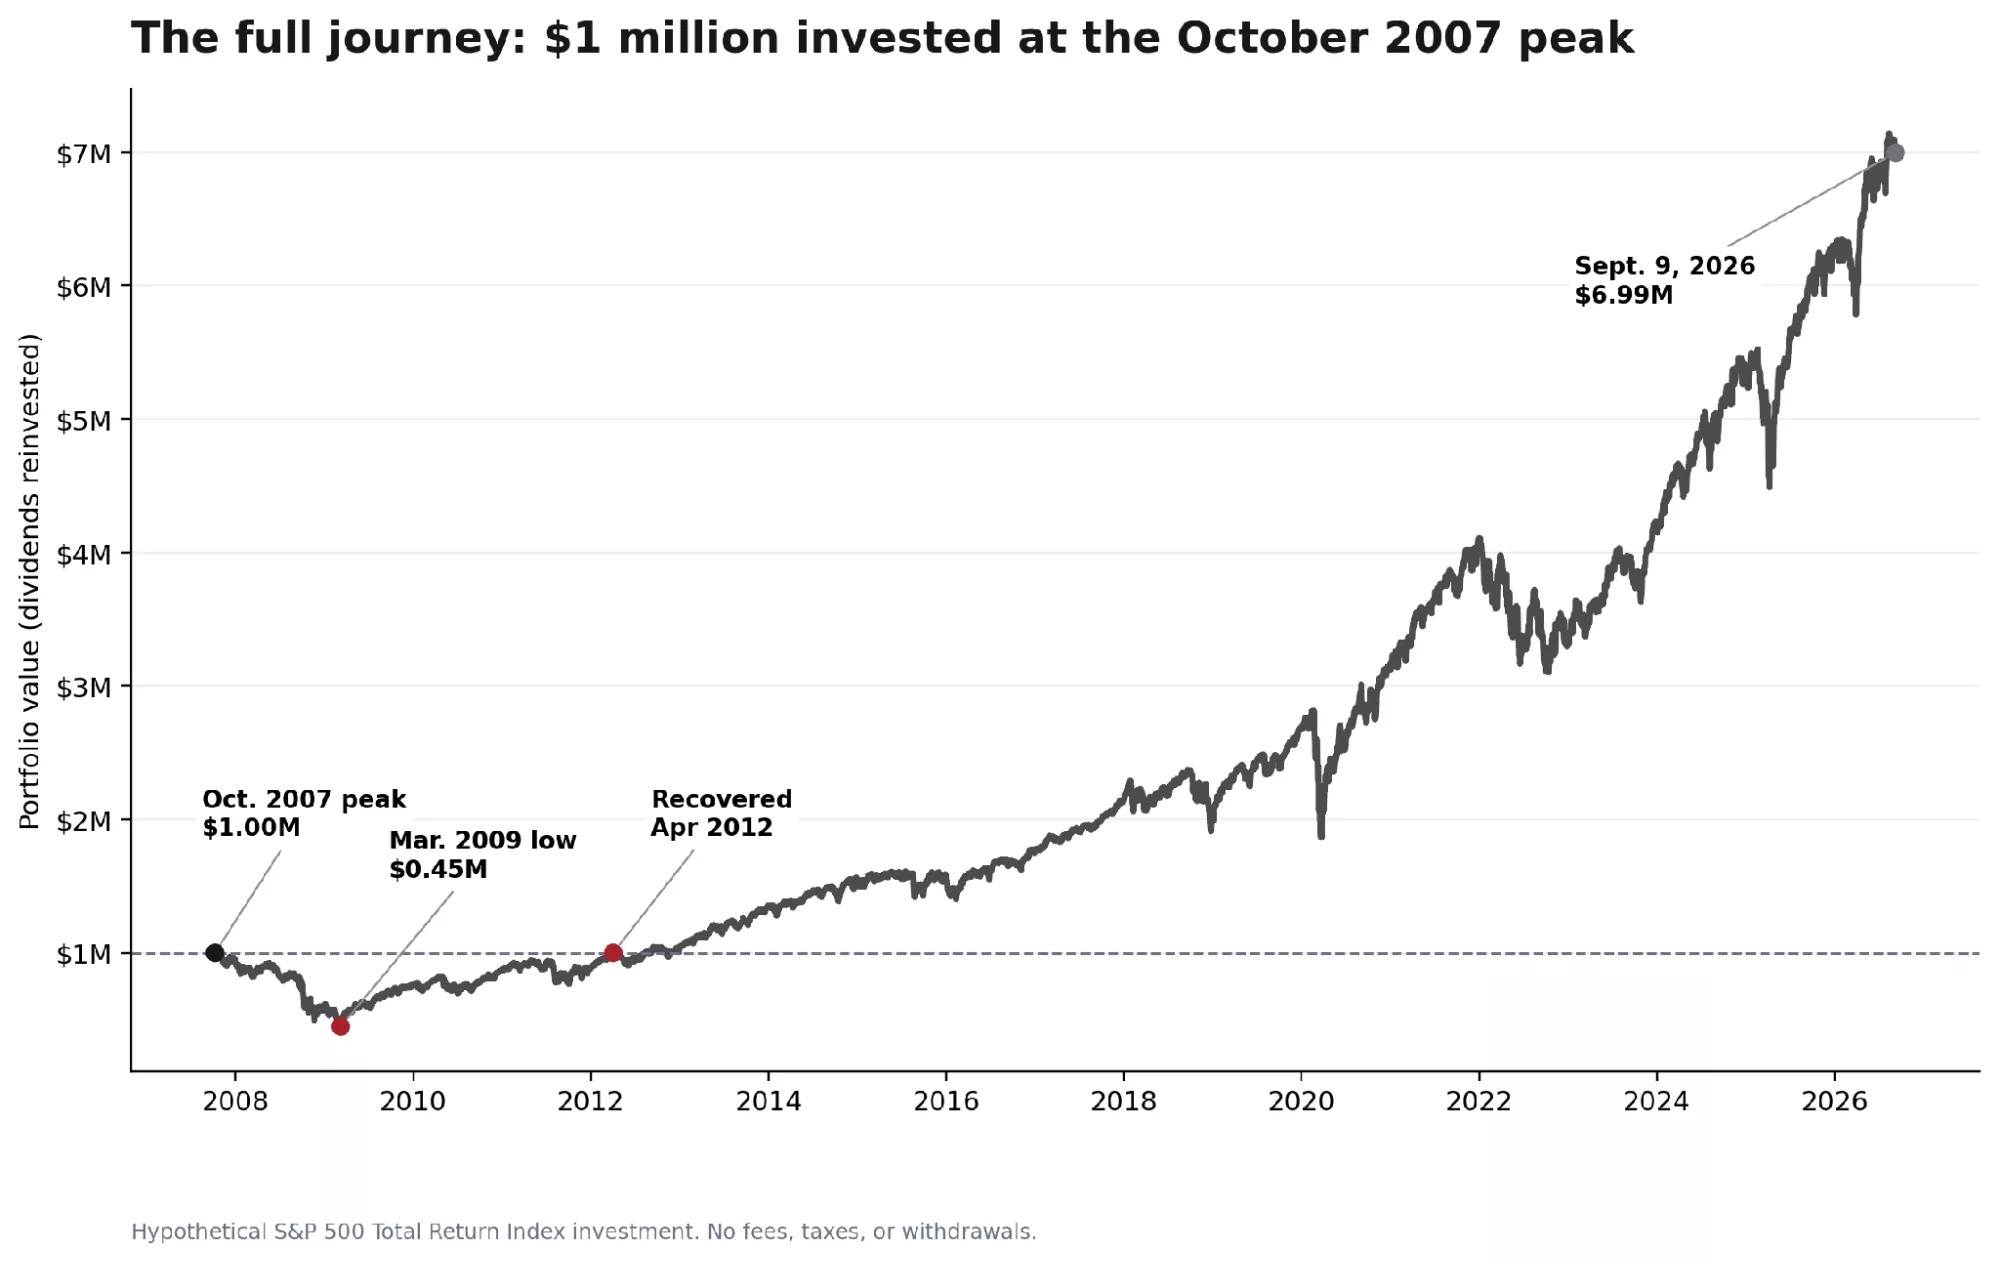
Two different recovery dates
Using total return, which includes reinvested dividends, the original $1 million recovered by April 2012. The S&P 500 price index did not regain its October 2007 closing level until March 2013. Dividends did not eliminate the decline, but they shortened the investor’s recovery.
Why getting back in is harder than getting out
- Selling provides immediate emotional relief, which can reinforce the decision.
- A reentry rule is rarely established before the sale.
- Every rebound can look temporary, while every setback appears to validate staying out.
- By the time the economy and headlines feel comfortable, prices may already be substantially higher.
The behavioral trap. The investor believes the first decision is “sell now and reassess later.” In practice, that creates two timing decisions: when to get out and when to get back in. Both must be sufficiently right after taxes and trading costs.
A question worth considering
What objective condition would cause you to reinvest after selling, and could you follow it while the news remained unsettling?
About the illustration
The hypothetical illustrations use the S&P 500 Total Return Index, assume reinvested dividends, and exclude fees, expenses, taxes, withdrawals, advisory charges, and transaction costs. After selling, the panic seller is modeled using the daily 3-month Treasury constant-maturity yield as an illustrative cash-equivalent proxy. The March 9, 2009 market low is used with hindsight and was not identifiable in advance.
This material is for educational purposes only and is not personalized investment advice or a recommendation. Indexes are unmanaged and cannot be invested in directly. Investing involves risk, including possible loss of principal. Past performance does not guarantee future results.
Securities and investment advisory services offered through &Partners, LLC, a broker-dealer and investment adviser registered with the U.S. Securities and Exchange Commission and member FINRA, SIPC.
This content was created with the assistance of artificial intelligence (AI).

